Section 5 Mining - RI2Genes
5.1 Input Interface
Input
Step 1: Enter a list of user-input genomic regions.Step 2: Specify the reference genome build. Ensure that the input genomic coordinates (Step 1) are consistent with the specified genome build (Step 2).Step 3: Select from a list of contexts available under different modalities (ABC, PCHiC, and QTL).
Output
- Example Output includes interactive tables showcasing regulatory genes and their corresponding evidence. Additionally, a summary of the input data and the runtime (computed on the server side) is provided to the users.
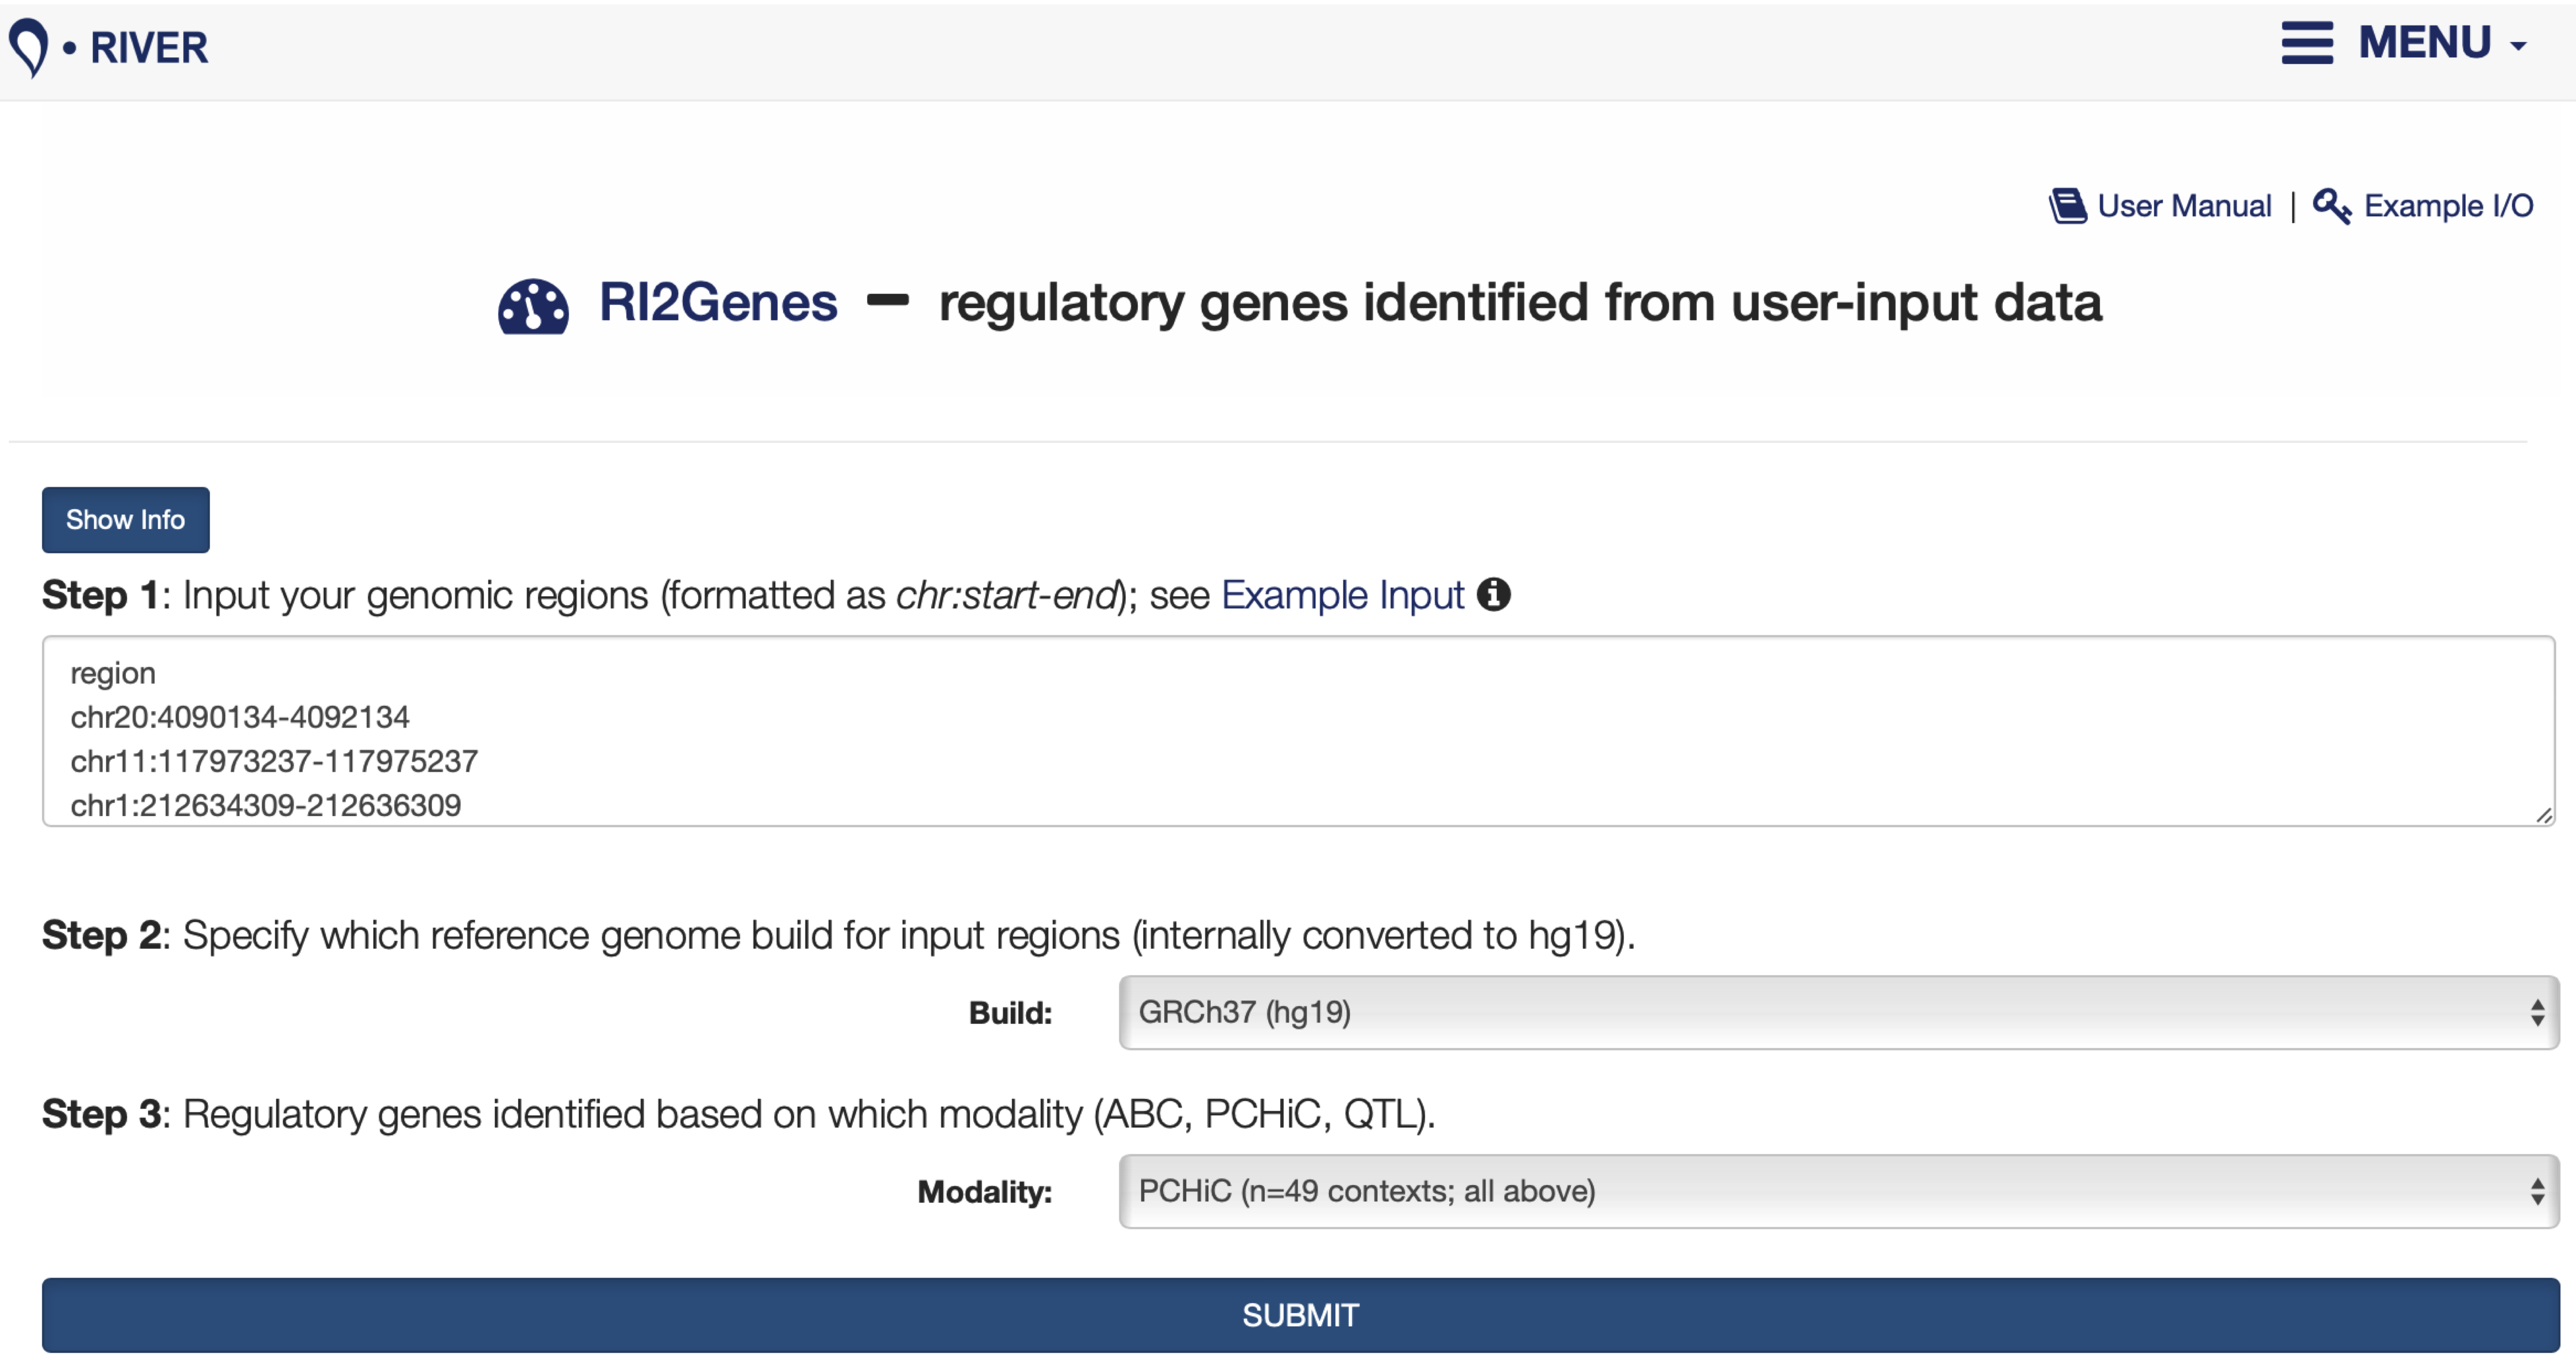
FIGURE 5.1: The RI2Genes interface is displayed.
5.2 Interactive Results
- Under the
Input Informationtab,Interactive tablelists user-input genomic regions.
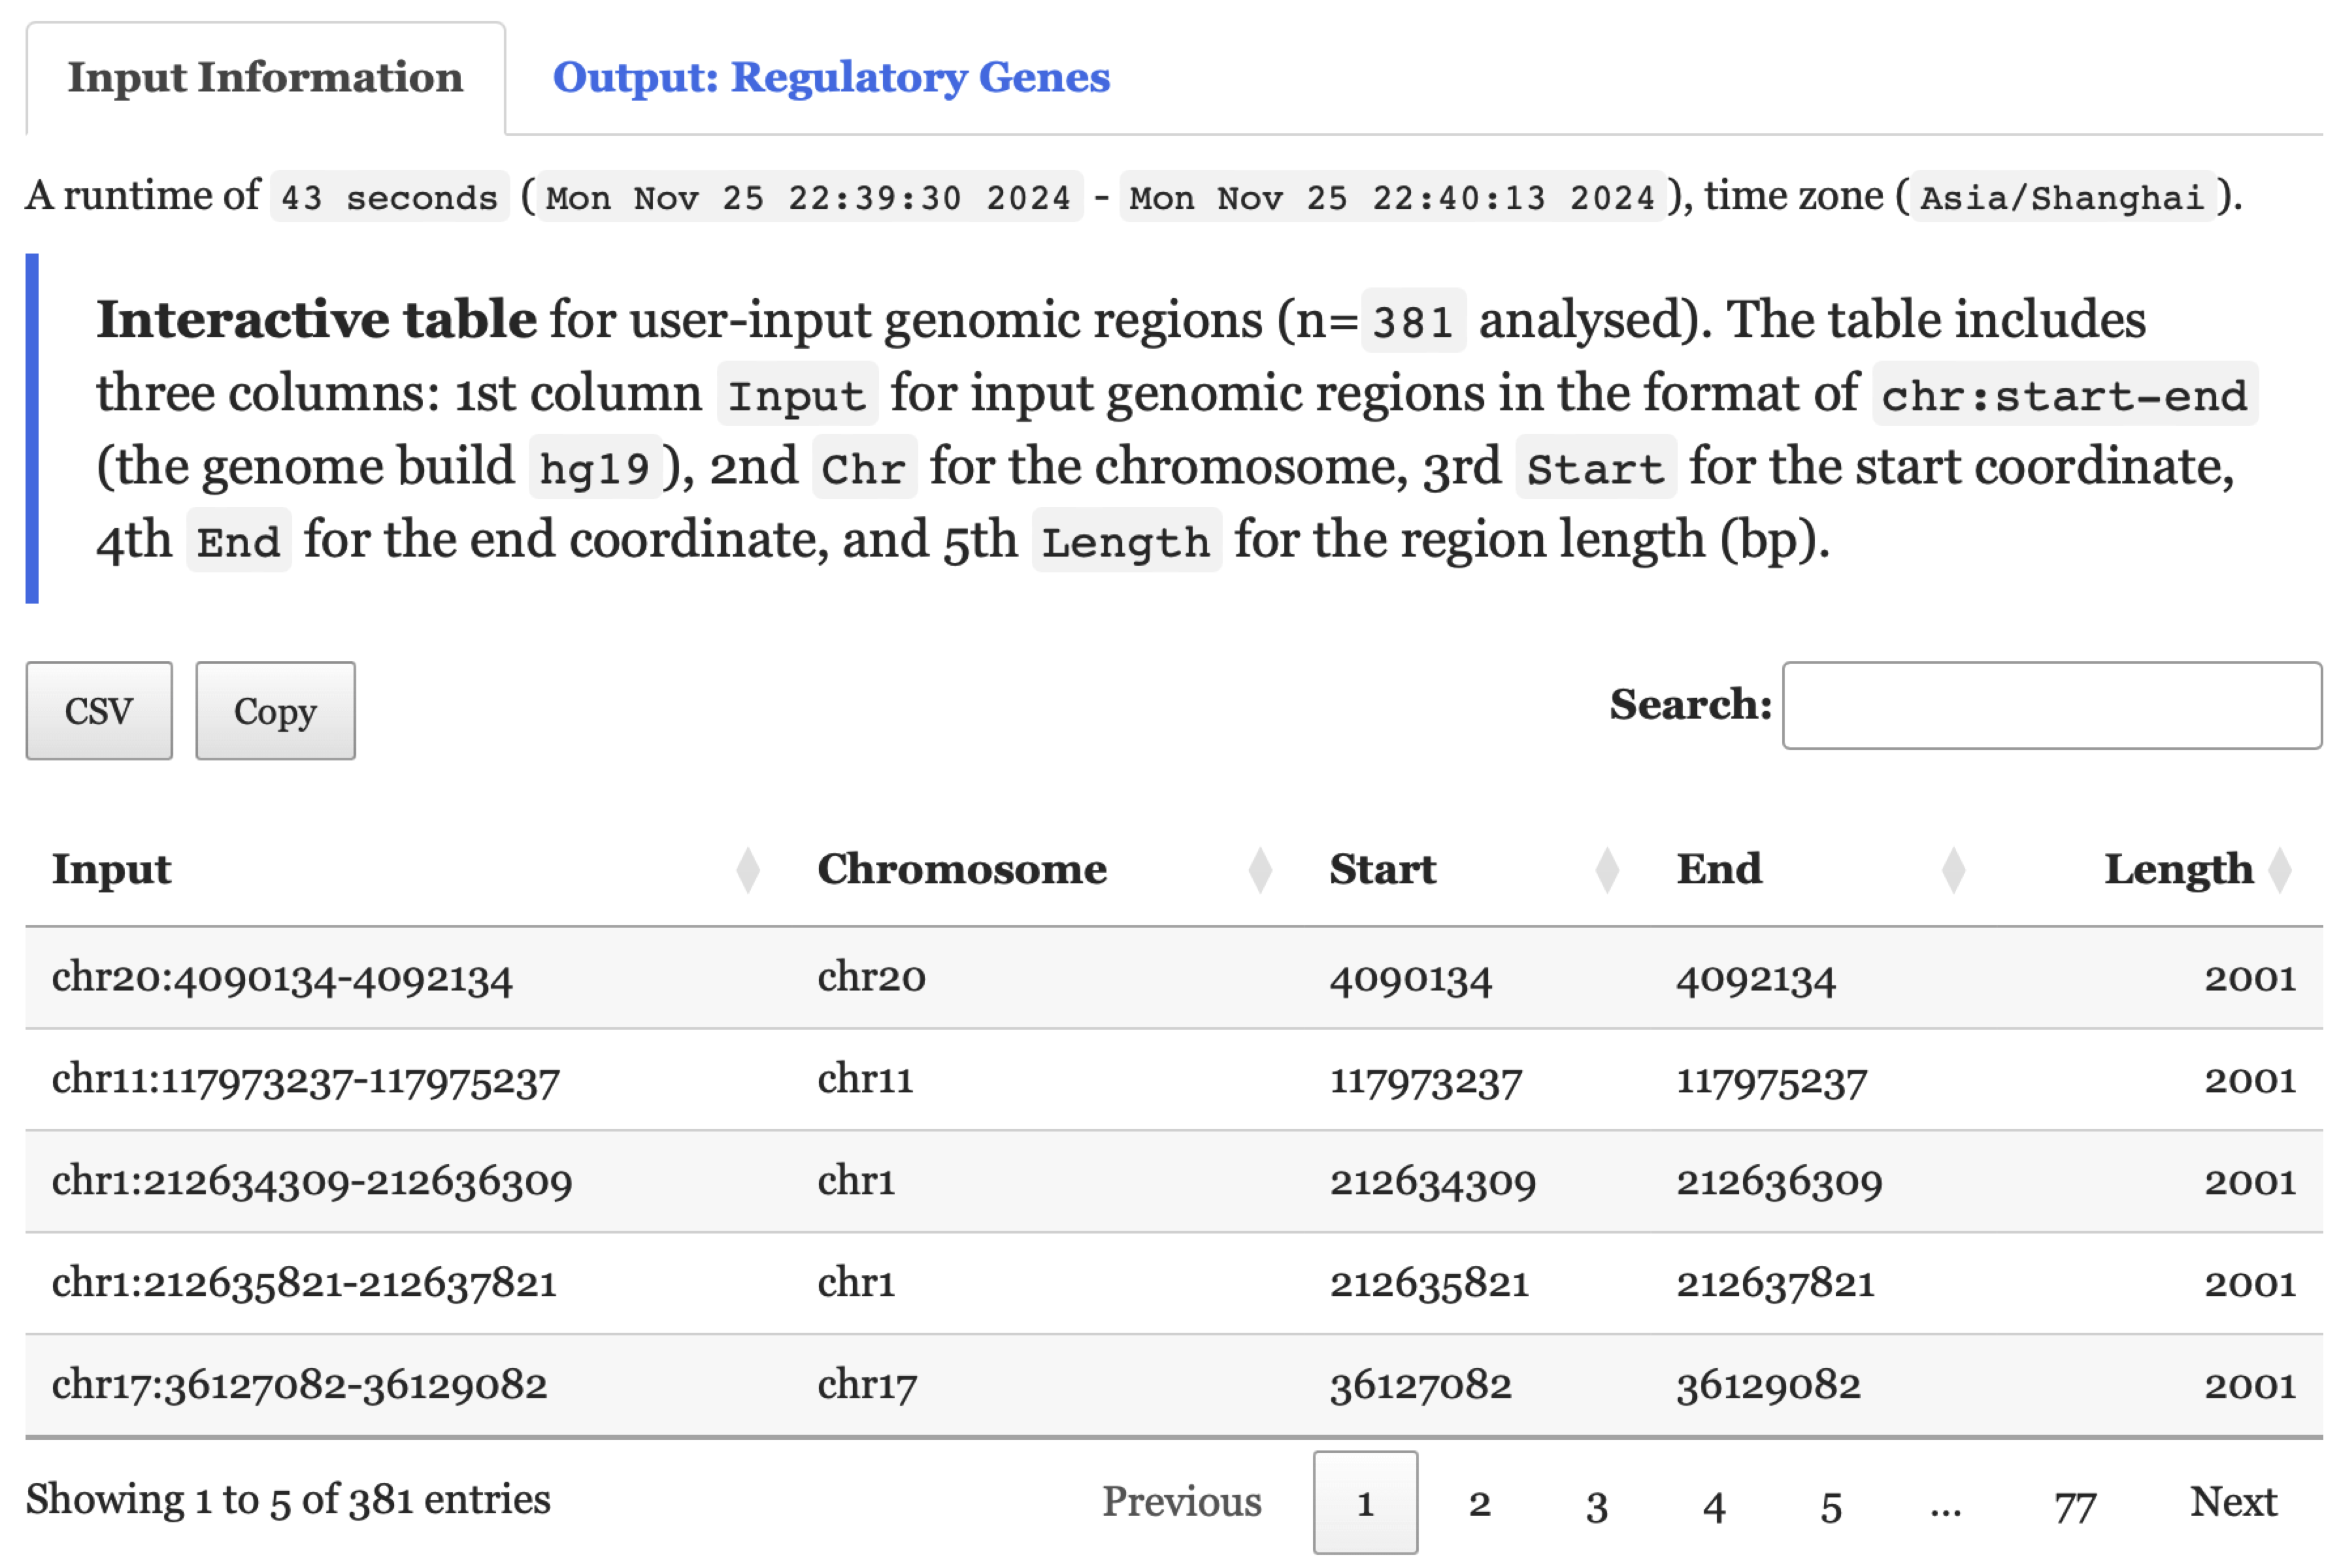
FIGURE 5.2: A summary table of the user-input data displayed under the Input Information tab for exploration.
- Under the
Output: Regulatory Genestab,Regulatory Gene tablelists regulatory genes. Each gene is hyperlinked to itsgene-specific information page.Evidence tableprovides information on how regulatory genes are identified, including the contexts and regulatory interactions associated with them.
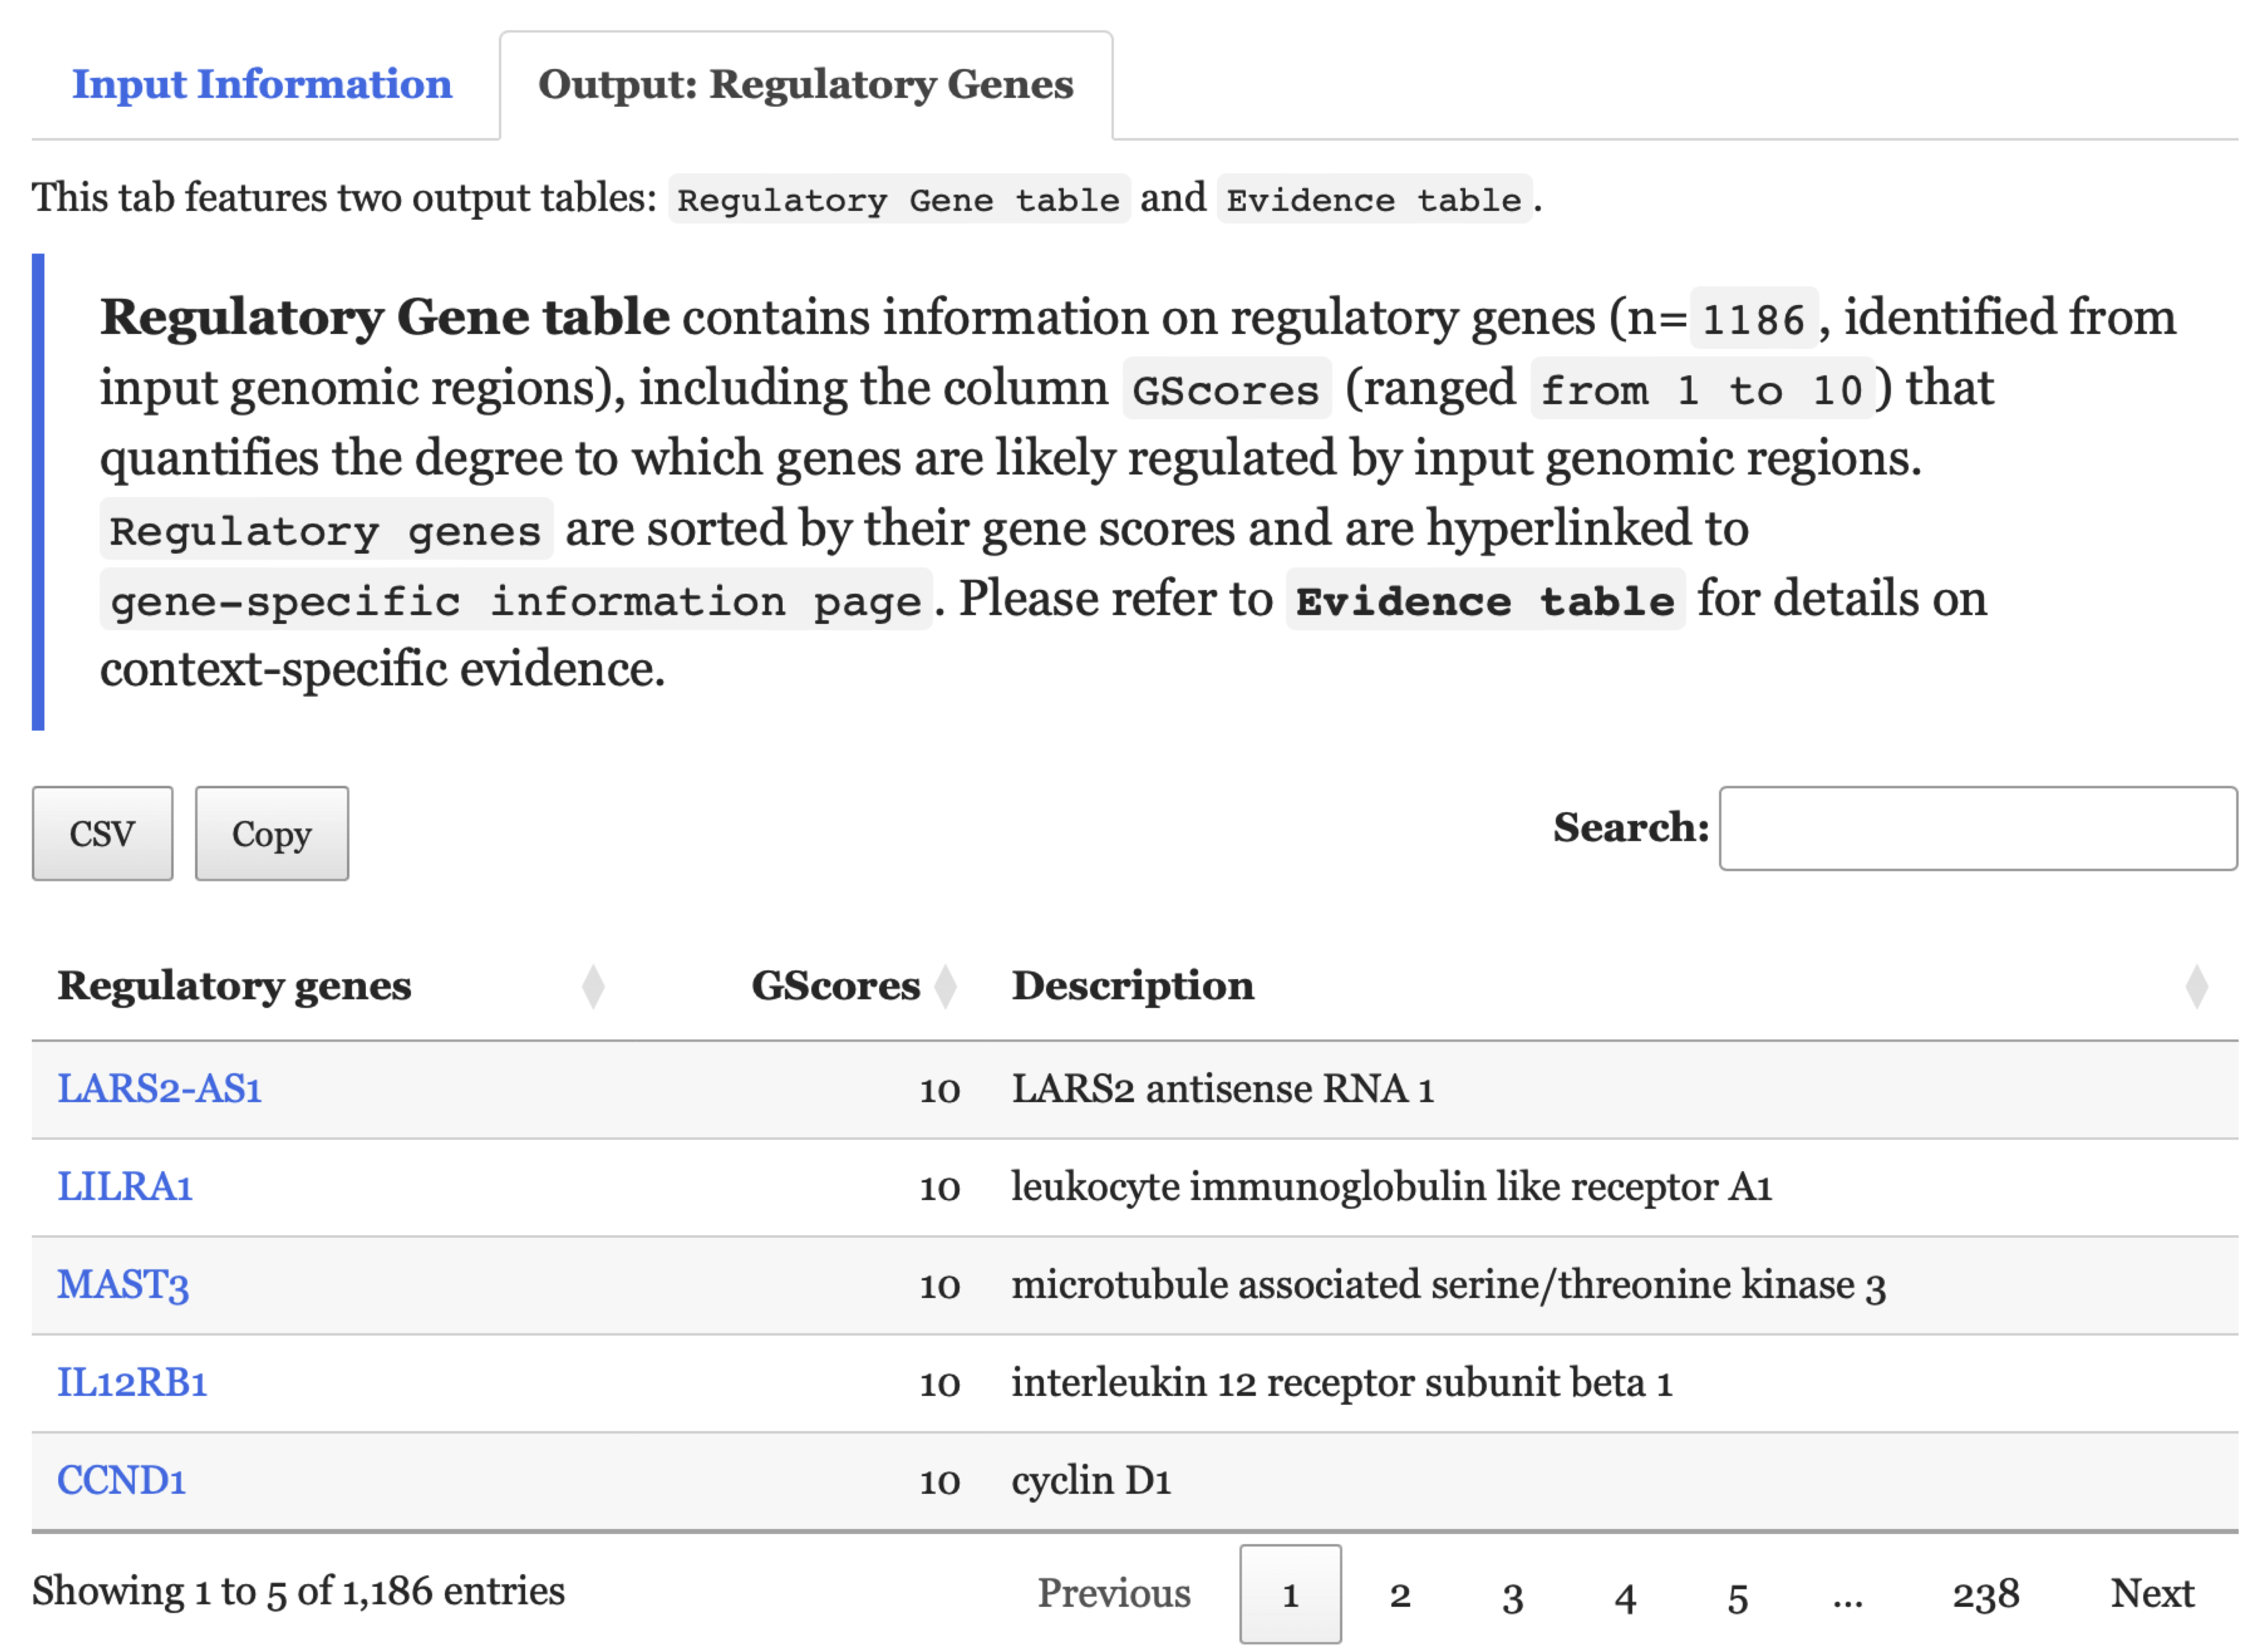
FIGURE 5.3: Regulatory Gene table within the Output: Regulatory Genes tab is depicted in this figure.